GDP and SP500
I already knew the stable growth path of GDP per capita in US when logarithm is applied in the last century. It has always been around 2% annual increase and the only big exception was the Great Depression. What I never saw before was the evolution of SP500 for those 100 year. It seems according to the chart that, although less stable, the average growth has been 1.9%. This chart was published by visualizingeconomics.com and they collected the data from David Shiller and Measuringworth.com.
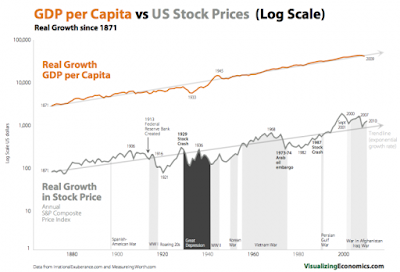 They also note that the 0.1% difference may well be due to the fact that the stock price series were adjusted for inflation using CPI-U while the GDP per Capita was adjusted with the GDP Deflator.

Comments
-----------------------
Writing Service